Adrixtercio
Chapuzas Senior
- Registrado
- 28 Jun 2019
- Mensajes
- 1.405
- Puntos
- 113
Hola, el caso es que veo este programa siendo usado por muchos compañeros del foro y no se muy bien como interpretar estos datos.... ¿alguien que sepa puede explicarme? Sobre todo por aprender 
[FONT="][h= PC Performing above expectations (83rd percentile)https://www.userbenchmark.com/Faq/What-is-the-UBM-PC-status/94]2[/h]Actual performance vs. expectations. The graphs show user score (x) vs user score frequency .
.
[/FONT]
[FONT="][/FONT]
[FONT="][/FONT]
[FONT="][TABLE="class: para-m-t uc-table table-no-border, width: 1420"]
[TR]
[/TR]
[TR]
[TH="align: left"]Processor[/TH]
[TH="align: center"]Benchhttps://www.userbenchmark.com/Faq/What-is-UBM-Effective-Speed/95[/TH]
[TH="align: center"]Normalhttps://cpu.userbenchmark.com/Faq/What-is-single-core-integer-speed/72[/TH]
[TH="align: center"]Heavyhttps://cpu.userbenchmark.com/Faq/What-is-quad-core-integer-speed/74[/TH]
[TH="align: center"]Extremehttps://cpu.userbenchmark.com/Faq/What-is-multi-core-integer-speed/79[/TH]
[/TR]
[TR]
[TD]
[TD]95.3%Outstanding
[/TD]
[TD]1-Core 140
2-Core 278
98% 209 Pts
[/TD]
[TD]4-Core 531
8-Core 981
94% 756 Pts
[/TD]
[TD]64-Core 1,463
98% 1,463 Pts
[/TD]
[/TR]
[TR]
[TD][/TD]
[/TR]
[/TABLE]
[/FONT][FONT="][/FONT][FONT="][/FONT]
[FONT="][TABLE="class: para-m-t uc-table table-no-border, width: 1420"]
[TR]
[/TR]
[TR]
[TH="align: left"]Graphics Card[/TH]
[TH="align: center"]Benchhttps://www.userbenchmark.com/Faq/What-is-UBM-Effective-Speed/95[/TH]
[TH="align: center"]3D DX9https://gpu.userbenchmark.com/Faq/What-are-the-DX09-GPU-tests/90[/TH]
[TH="align: center"]3D DX10https://gpu.userbenchmark.com/Faq/What-are-the-DX10-GPU-tests/91[/TH]
[TH="align: center"]3D DX11https://gpu.userbenchmark.com/Faq/What-are-the-DX11-GPU-tests/92[/TH]
[/TR]
[TR]
[TD]
[TD]62.6%Good
[/TD]
[TD]Lighting 217
Reflection 177
Parallax 274
57% 223 fps
[/TD]
[TD]MRender 151
Gravity 234
Splatting 137
63% 174 fps
[/TD]
[/TR]
[TR]
[TD]
[/TR]
[/TABLE]
[/FONT][FONT="][/FONT][FONT="][/FONT]
[FONT="][TABLE="class: para-m-t uc-table table-no-border, width: 1420"]
[TR]
[/TR]
[TR]
[TH="align: left"]Drives[/TH]
[TH="align: center"]Benchhttps://www.userbenchmark.com/Faq/What-is-UBM-Effective-Speed/95[/TH]
[TH="align: center"]Sequentialhttps://www.userbenchmark.com/Faq/What-is-sequential-read-speed/44[/TH]
[TH="align: center"]Random 4khttps://www.userbenchmark.com/Faq/What-is-4K-random-read-speed/28[/TH]
[TH="align: center"]Deep queue 4khttps://ssd.userbenchmark.com/Faq/What-is-4K-64-thread-read-speed/58[/TH]
[/TR]
[TR]
[TD]
[TD]235%Outstanding
[/TD]
[TD]Read 1,787
Write 1,477
Mixed 1,363
SusWrite 467
284% 1,274 MB/s
[/TD]
[TD]4K Read 51.9
4K Write 221
4K Mixed 80.5
299% 118 MB/s
[/TD]
[TD]DQ Read 848
DQ Write 1102
DQ Mixed 797
651% 916 MB/s
[/TD]
[/TR]
[TR]
[TD][/TD]
[/TR]
[TR]
[TD]
[TD]70.4%Very good
[/TD]
[TD]Read 386
Write 264
Mixed 282
SusWrite 95.1
57% 257 MB/s
[/TD]
[TD]4K Read 30.6
4K Write 96.5
4K Mixed 24.4
129% 50.5 MB/s
[/TD]
[TD]DQ Read 161
DQ Write 339
DQ Mixed 137
136% 212 MB/s
[/TD]
[/TR]
[TR]
[TD][/TD]
[/TR]
[TR]
[TD]
[TD]110%Outstanding
[/TD]
[TD]Read 186
Write 194
Mixed 88.7
SusWrite 196
122% 166 MB/s
[/TD]
[TD]4K Read 0.8
4K Write 1.5
4K Mixed 0.8
150% 1.03 MB/s
[/TD]
[/TR]
[TR]
[TD][/TD]
[/TR]
[/TABLE]
[/FONT][FONT="][/FONT][FONT="][/FONT]
[FONT="][TABLE="class: para-m-t uc-table table-no-border, width: 1420"]
[TR]
[/TR]
[TR]
[TH="align: left"]Memory Kit[/TH]
[TH="align: center"]Benchhttps://www.userbenchmark.com/Faq/What-is-UBM-Effective-Speed/95[/TH]
[TH="align: center"]Multi core[/TH]
[TH="align: center"]Single core[/TH]
[TH="align: center"]Latency[/TH]
[/TR]
[TR]
[TD]
[TD]83.9%Excellent
[/TD]
[TD]MC Read 30.7
MC Write 24.1
MC Mixed 33.5
84% 29.4 GB/s
[/TD]
[TD]SC Read 26.1
SC Write 24
SC Mixed 33.8
80% 28 GB/s
[/TD]
[TD]Latency 70.9
56% 70.9 ns
[/TD]
[/TR]
[TR]
[TD][/TD]
[/TR]
[/TABLE]
[/FONT][FONT="][/FONT] Take a copy of your results
[FONT="][h=]2[/h][/FONT]
[FONT="][h= PC Performing above expectations (83rd percentile)https://www.userbenchmark.com/Faq/What-is-the-UBM-PC-status/94]2[/h]Actual performance vs. expectations. The graphs show user score (x) vs user score frequency
[/FONT]
[FONT="][/FONT]
[FONT="][/FONT]
[FONT="][TABLE="class: para-m-t uc-table table-no-border, width: 1420"]
[TR]
[/TR]
[TR]
[TH="align: left"]Processor[/TH]
[TH="align: center"]Benchhttps://www.userbenchmark.com/Faq/What-is-UBM-Effective-Speed/95[/TH]
[TH="align: center"]Normalhttps://cpu.userbenchmark.com/Faq/What-is-single-core-integer-speed/72[/TH]
[TH="align: center"]Heavyhttps://cpu.userbenchmark.com/Faq/What-is-quad-core-integer-speed/74[/TH]
[TH="align: center"]Extremehttps://cpu.userbenchmark.com/Faq/What-is-multi-core-integer-speed/79[/TH]
[/TR]
[TR]
[TD]

AMD Ryzen 7 3700X-лв 505
130,964 User benchmarks, average bench 92%
AM4, 1 CPU, 8 cores, 16 threads
Base clock 3.6 GHz, turbo 4.15 GHz (avg)
Performing above expectations (75th percentile)https://www.userbenchmark.com/Faq/What-is-the-UBM-PC-status/94
[/TD]130,964 User benchmarks, average bench 92%
AM4, 1 CPU, 8 cores, 16 threads
Base clock 3.6 GHz, turbo 4.15 GHz (avg)
Performing above expectations (75th percentile)https://www.userbenchmark.com/Faq/What-is-the-UBM-PC-status/94
[TD]95.3%Outstanding
[/TD]
[TD]1-Core 140
2-Core 278
98% 209 Pts
[/TD]
[TD]4-Core 531
8-Core 981
94% 756 Pts
[/TD]
[TD]64-Core 1,463
98% 1,463 Pts
[/TD]
[/TR]
[TR]
[TD][/TD]
[/TR]
[/TABLE]
[/FONT][FONT="][/FONT][FONT="][/FONT]
[FONT="][TABLE="class: para-m-t uc-table table-no-border, width: 1420"]
[TR]
[/TR]
[TR]
[TH="align: left"]Graphics Card[/TH]
[TH="align: center"]Benchhttps://www.userbenchmark.com/Faq/What-is-UBM-Effective-Speed/95[/TH]
[TH="align: center"]3D DX9https://gpu.userbenchmark.com/Faq/What-are-the-DX09-GPU-tests/90[/TH]
[TH="align: center"]3D DX10https://gpu.userbenchmark.com/Faq/What-are-the-DX10-GPU-tests/91[/TH]
[TH="align: center"]3D DX11https://gpu.userbenchmark.com/Faq/What-are-the-DX11-GPU-tests/92[/TH]
[/TR]
[TR]
[TD]

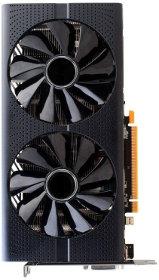
AMD RX 580-лв 269
393,137 User benchmarks, average bench 57%
Sapphire(1DA2 E366)
CLim: 1420 MHz, MLim: 2000 MHz, Ram: 8GB, Driver: 20.3.1
Performing way above expectations (99th percentile)https://www.userbenchmark.com/Faq/What-is-the-UBM-PC-status/94
[/TD]393,137 User benchmarks, average bench 57%
Sapphire(1DA2 E366)
CLim: 1420 MHz, MLim: 2000 MHz, Ram: 8GB, Driver: 20.3.1
Performing way above expectations (99th percentile)https://www.userbenchmark.com/Faq/What-is-the-UBM-PC-status/94
[TD]62.6%Good
[/TD]
[TD]Lighting 217
Reflection 177
Parallax 274
57% 223 fps
[/TD]
[TD]MRender 151
Gravity 234
Splatting 137
63% 174 fps
[/TD]
[/TR]
[TR]
[TD]
EFps Game Bottlenecks
[/TD][/TR]
[/TABLE]
[/FONT][FONT="][/FONT][FONT="][/FONT]
[FONT="][TABLE="class: para-m-t uc-table table-no-border, width: 1420"]
[TR]
[/TR]
[TR]
[TH="align: left"]Drives[/TH]
[TH="align: center"]Benchhttps://www.userbenchmark.com/Faq/What-is-UBM-Effective-Speed/95[/TH]
[TH="align: center"]Sequentialhttps://www.userbenchmark.com/Faq/What-is-sequential-read-speed/44[/TH]
[TH="align: center"]Random 4khttps://www.userbenchmark.com/Faq/What-is-4K-random-read-speed/28[/TH]
[TH="align: center"]Deep queue 4khttps://ssd.userbenchmark.com/Faq/What-is-4K-64-thread-read-speed/58[/TH]
[/TR]
[TR]
[TD]

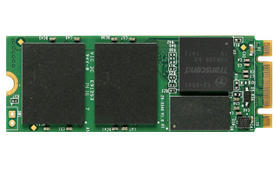
WD Black SN750 NVMe PCIe M.2 250GB (2019)-лв 106
3,578 User benchmarks, average bench 200%
191GB free (System drive)
Firmware: 102000WD Max speed: PCIe 5,000 MB/s
SusWrite @10s intervals: 663 429 425 428 428 428 MB/s
Performing way above expectations (99th percentile)https://www.userbenchmark.com/Faq/What-is-the-UBM-PC-status/94
[/TD]3,578 User benchmarks, average bench 200%
191GB free (System drive)
Firmware: 102000WD Max speed: PCIe 5,000 MB/s
SusWrite @10s intervals: 663 429 425 428 428 428 MB/s
Performing way above expectations (99th percentile)https://www.userbenchmark.com/Faq/What-is-the-UBM-PC-status/94
[TD]235%Outstanding
[/TD]
[TD]Read 1,787
Write 1,477
Mixed 1,363
SusWrite 467
284% 1,274 MB/s
[/TD]
[TD]4K Read 51.9
4K Write 221
4K Mixed 80.5
299% 118 MB/s
[/TD]
[TD]DQ Read 848
DQ Write 1102
DQ Mixed 797
651% 916 MB/s
[/TD]
[/TR]
[TR]
[TD][/TD]
[/TR]
[TR]
[TD]

Kingston A400 120GB-лв 46
69,726 User benchmarks, average bench 59%
27GB free
Firmware: SBFK71E0
SusWrite @10s intervals: 238 56 82 82 56 57 MB/s
Performing above expectations (81st percentile)https://www.userbenchmark.com/Faq/What-is-the-UBM-PC-status/94
[/TD]69,726 User benchmarks, average bench 59%
27GB free
Firmware: SBFK71E0
SusWrite @10s intervals: 238 56 82 82 56 57 MB/s
Performing above expectations (81st percentile)https://www.userbenchmark.com/Faq/What-is-the-UBM-PC-status/94
[TD]70.4%Very good
[/TD]
[TD]Read 386
Write 264
Mixed 282
SusWrite 95.1
57% 257 MB/s
[/TD]
[TD]4K Read 30.6
4K Write 96.5
4K Mixed 24.4
129% 50.5 MB/s
[/TD]
[TD]DQ Read 161
DQ Write 339
DQ Mixed 137
136% 212 MB/s
[/TD]
[/TR]
[TR]
[TD][/TD]
[/TR]
[TR]
[TD]

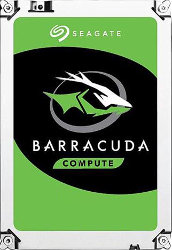
Seagate Barracuda 1TB (2016)-лв 62
433,247 User benchmarks, average bench 91%
759GB free
Firmware: CC43
SusWrite @10s intervals: 197 195 195 198 199 195 MB/s
Performing way above expectations (86th percentile)https://www.userbenchmark.com/Faq/What-is-the-UBM-PC-status/94
[/TD]433,247 User benchmarks, average bench 91%
759GB free
Firmware: CC43
SusWrite @10s intervals: 197 195 195 198 199 195 MB/s
Performing way above expectations (86th percentile)https://www.userbenchmark.com/Faq/What-is-the-UBM-PC-status/94
[TD]110%Outstanding
[/TD]
[TD]Read 186
Write 194
Mixed 88.7
SusWrite 196
122% 166 MB/s
[/TD]
[TD]4K Read 0.8
4K Write 1.5
4K Mixed 0.8
150% 1.03 MB/s
[/TD]
[/TR]
[TR]
[TD][/TD]
[/TR]
[/TABLE]
[/FONT][FONT="][/FONT][FONT="][/FONT]
[FONT="][TABLE="class: para-m-t uc-table table-no-border, width: 1420"]
[TR]
[/TR]
[TR]
[TH="align: left"]Memory Kit[/TH]
[TH="align: center"]Benchhttps://www.userbenchmark.com/Faq/What-is-UBM-Effective-Speed/95[/TH]
[TH="align: center"]Multi core[/TH]
[TH="align: center"]Single core[/TH]
[TH="align: center"]Latency[/TH]
[/TR]
[TR]
[TD]

Crucial BLS8G4D26BFSCK.8FBD 2x8GB
964 User benchmarks, average bench 82%
2 of 4 slots used
16GB DIMM DDR4 clocked @ 3200 MHz
Performing as expected (59th percentile)https://www.userbenchmark.com/Faq/What-is-the-UBM-PC-status/94
[/TD]964 User benchmarks, average bench 82%
2 of 4 slots used
16GB DIMM DDR4 clocked @ 3200 MHz
Performing as expected (59th percentile)https://www.userbenchmark.com/Faq/What-is-the-UBM-PC-status/94
[TD]83.9%Excellent
[/TD]
[TD]MC Read 30.7
MC Write 24.1
MC Mixed 33.5
84% 29.4 GB/s
[/TD]
[TD]SC Read 26.1
SC Write 24
SC Mixed 33.8
80% 28 GB/s
[/TD]
[TD]Latency 70.9
56% 70.9 ns
[/TD]
[/TR]
[TR]
[TD][/TD]
[/TR]
[/TABLE]
[/FONT][FONT="][/FONT] Take a copy of your results
[FONT=Open Sans, Helvetica Neue, Helvetica, Arial, sans-serif]
[/FONT]
[FONT="][/FONT][FONT="][/FONT][/FONT]
[FONT="][h=]2[/h][/FONT]
Última edición:

